
Understanding Bitcoin's 'Bart Simpson' Pattern and Its Implications
By Staff · Sep 3, 2026 · 4 views
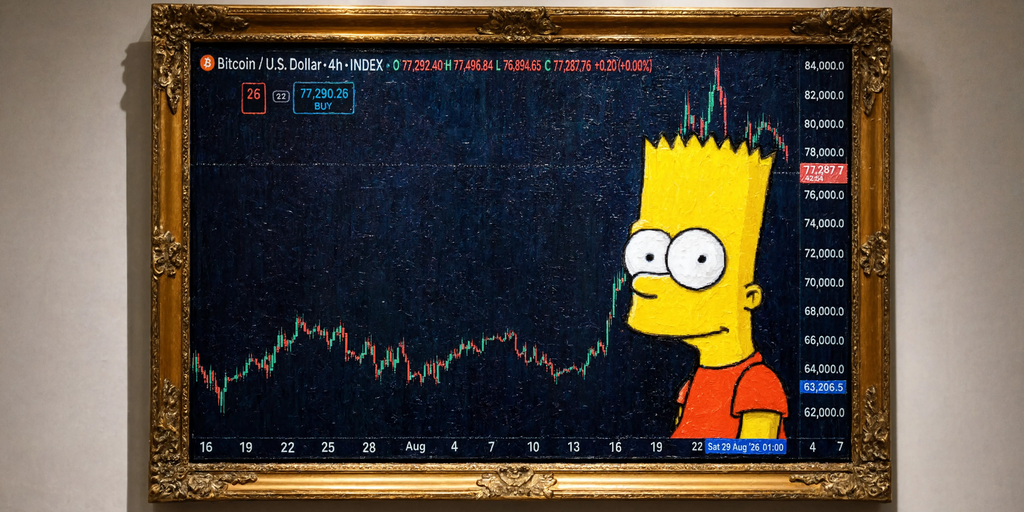
In the world of Bitcoin trading, patterns often emerge that traders use to predict market movements. One such pattern that has caught the attention of traders is the 'Bart Simpson' pattern, named for its resemblance to the spiky hairline of the iconic cartoon character. This pattern was notably observed during Bitcoin's price movements in August, characterized by a sudden spike followed by a rapid decline.
The 'Bart Simpson' pattern is often mistaken for a flash crash, but there are key differences. A flash crash is a rapid, deep, and volatile drop in asset prices, typically followed by a quick recovery. In contrast, the 'Bart Simpson' pattern involves a spike and fade that can appear more like a market correction rather than a crash.
Understanding these patterns is crucial for traders looking to navigate the volatile Bitcoin market. While a flash crash can be triggered by external factors such as market manipulation or technical glitches, the 'Bart Simpson' pattern may simply reflect the natural ebb and flow of market sentiment.
For traders, recognizing these patterns can provide insights into potential market movements and help in strategizing trades. However, it's important to approach such patterns with caution, as the cryptocurrency market is inherently unpredictable.
For more detailed insights into the 'Bart Simpson' pattern and its implications for Bitcoin trading, visit the original article on Decrypt.